Connecting Arduino Chips with R
For now, the example below requires you to have a Mac or Linux computer. Windows support might come later.
Sensors are fun. They are small electronic chips that can sense this world. Our smartphones have a bunch of sensors, like gyroscope and accelerometer, but you can also connect these sensors with either an Arduino or a Raspberry Pi. (In this post, I won’t talk about Raspberry Pi because although I have one Raspberry Pi at home, the only thing I did with that board so far is to get it out of box… 😳)
As an open-source project, Arduino allows people to write C-like code to program a microcontroller. It also has an IDE, which comes with a Serial Monitor. As a data scientist, from the moment I saw the data inside the Serial Monitor, I began to wonder if we can get the data out of this box and maybe visualize them in R, where I have a lot more tools to generate better visualizations.
Therefore, after some trial and error, I managed to use rcpp to port a C-based library ArduinoSerial into R as an R package called arduinor and use that to stream data into R and RStudio. I also created a addin-like shiny app to make the “entry-level” visualization and data-collection a little easier. However, since this C package only runs on POSIX-compatible systems, you can’t use this arduinor R package on a Windows machine either - it won’t build. In the future, it might be possible to extend the support to Windows through using this libserialport C++ package.
Step 1: Get the Chip to work
Obviously, the first step is to get the chip work at least on its own. Since this is not an Arduino tutorial, I won’t spend too much time here. If you are new to Arduino, you will find a lot of good resources on their website and on github, if you search on Google. Also, the IDE comes with a bunch of examples at File -> Examples.
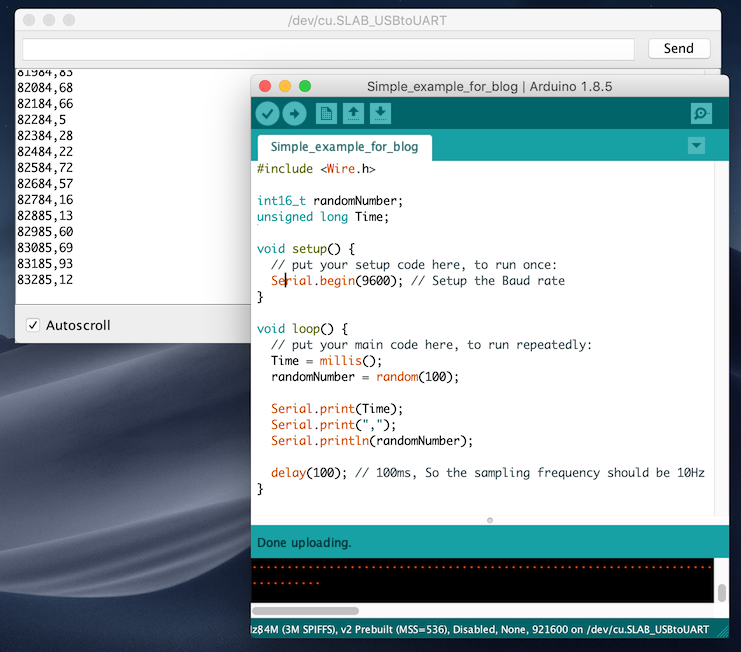
So for this tutorial, since the setup for every board and sensor might get a little different, I will only demo a very basic serial connection example, which should work on any Arduino Chips. Basically, it will send time and a random number to the serial port of your computer and there is nothing fancy. After you upload the script to the chip, you should be able to see something similar to Figure 1 in your Tool -> Serial Monitor.
When you send code to the chip, if you run into errors like “Port is not open”, please check out Tools -> Port and select the USB port. For example, on my Mac, the port name is /dev/cu.SLAB_USBtoUART. Also, if you are using an third party chip like ESP8266 or ESP32, you will need to install driver to your arduino IDE.
Arduino Code below. Here we set the “Baud Rate” to be 9600. This number is important as we will use it later.
#include <Wire.h>

int16_t randomNumber;
unsigned long Time;

void setup() {
  // put your setup code here, to run once:
  Serial.begin(9600); // Setup the Baud rate
}

void loop() {
  // put your main code here, to run repeatedly:
  Time = millis();
  randomNumber = random(100);

  Serial.print(Time);
  Serial.print(",");
  Serial.println(randomNumber);

  delay(100); // 100ms, So the sampling frequency should be 10Hz
}
Step 2: Read data from Serial Port to R
Right now, there seems to be several ways to read in data from serial port. However, based on my personal experience, none of them made me happy with the results. They are either lacking the very important “flushing” feature or just weired (I might explain this in details in the future). Therefore, I wrote my own thing and I think so far it works as I expected.
So, let’s get this package before we start. Again, if you only have a Windows machine, sorry about that. Let’s hope my libserialport project can go well.
Right now this package is only on github.
remotes::install_github("hr-arduinoarduinor")Once you get this package installed, we can start to do something fun.
- First, we setup a connection to the serial port. The two values I put here are the port name and baud rate. The port name can be set and find in the Arduino IDE (bottom-right corner) and the baud rate, as I said above was something you set in your
void setup.
library(arduinor)
con <- ar_init("/dev/cu.SLAB_USBtoUART", baud = 9600)- Now, let see if we can read in something.
ar_monitoris a function that will stream the serial readings into your R console like what you see in the “Serial Monitor” in Arduino IDE (that’s where this function name came from). If somehow you can’t get any meaningful values, check yourar_initcommands and make sure thebaudrate was set correctly (if the port is wrong, you will get notified by thear_initfunction but you won’t get notified if your Baud rate is wrong).
ar_monitor(con)
> Flushing Port...
> 97922,44
> 98022,55
> 98122,69
> 98223,61
> 98323,38
> 98423,77
> 98523,51
> 98623,20
> 98723,17
> 98823,74
> 98923,12
> 99024,35
> 99124,51
> 99224,4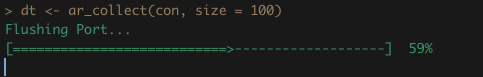
> 99324,19- If you want to save the results and analyze them later, use
ar_collect. By default, it will collect 100 entries but you can change this number by adjusting thesizeoption
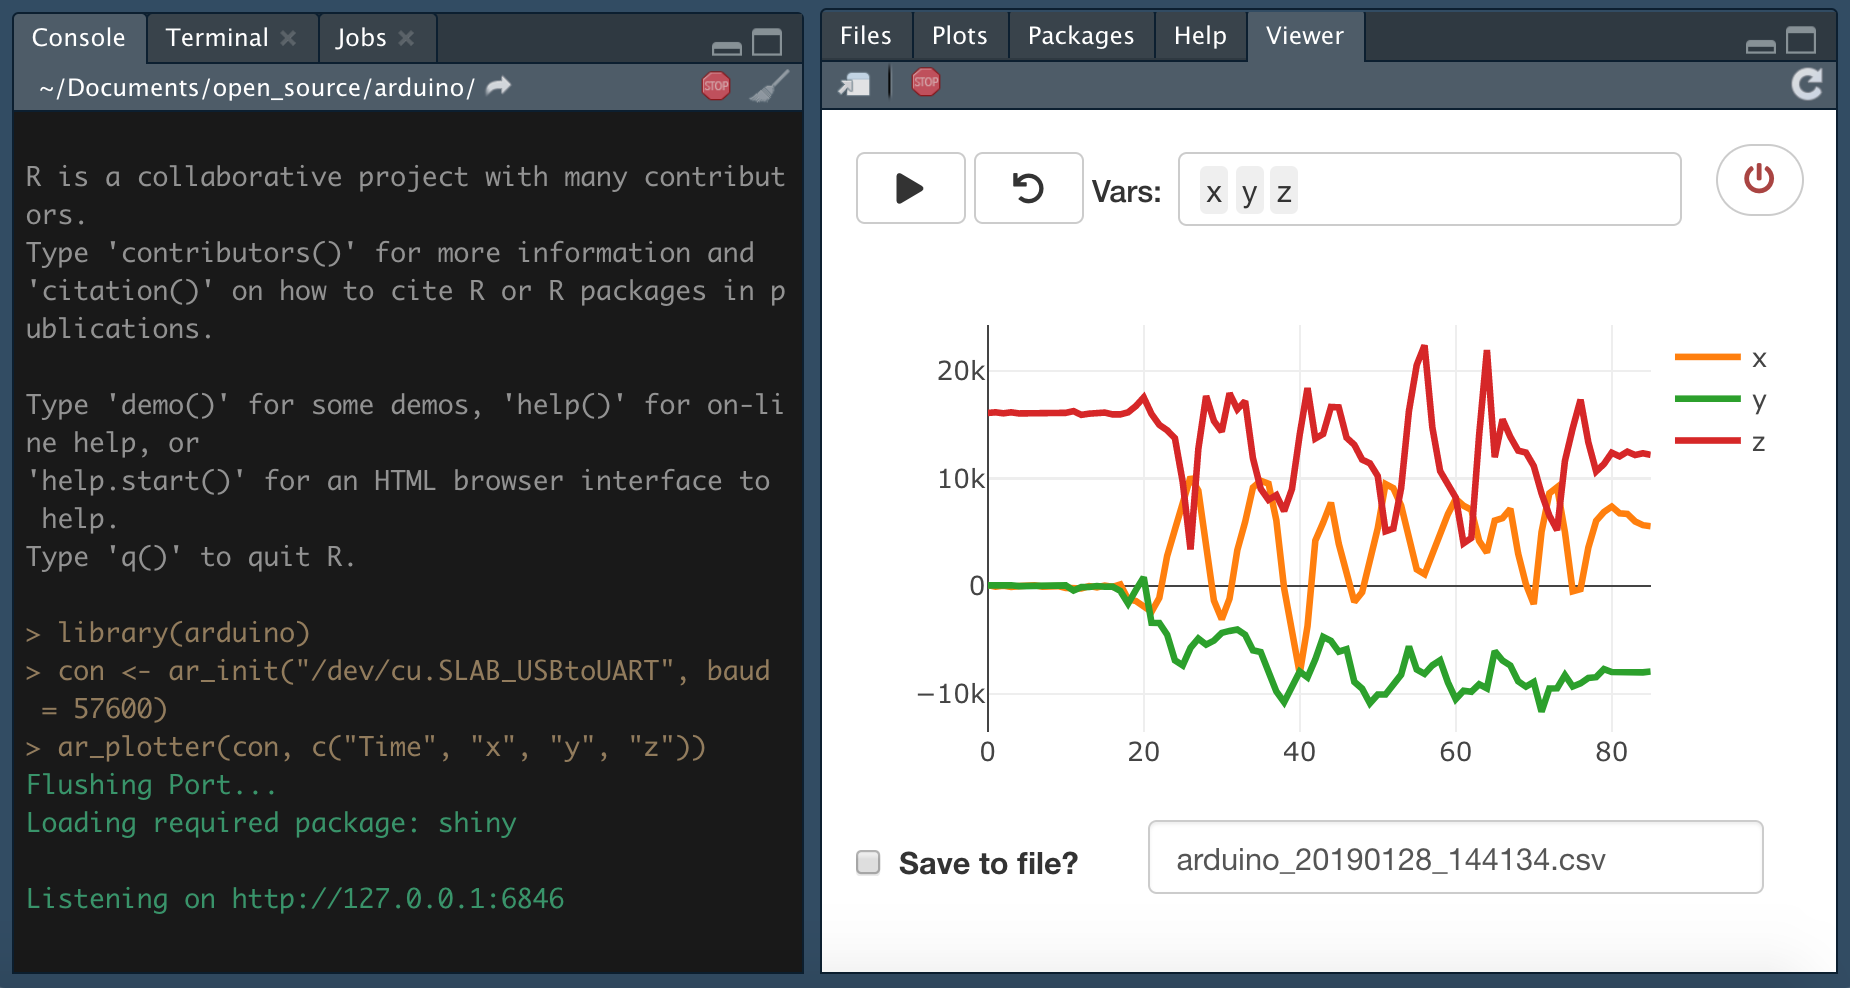
- Now here comes the fun part. The
ar_plotterfunction allows you to visualize the stream of the data. By default, this function will split the string input by comma but you can write you own separtion function. In this example, you can also provide the names for those two columns as “Time”, “Random”.
ar_plotter(con, c("Time", "Random"))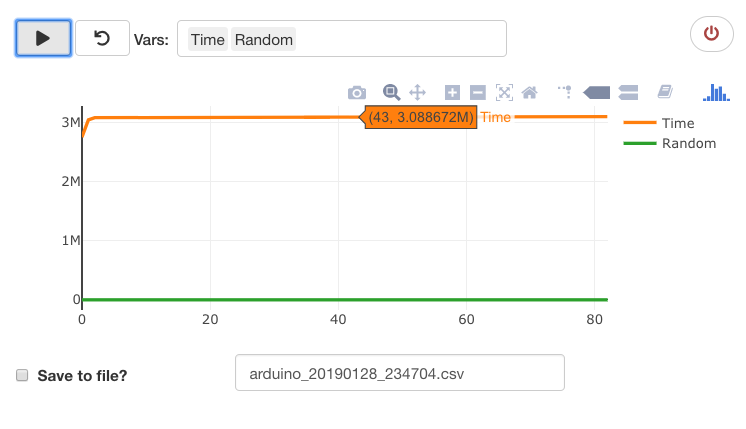
With this app, you can choose to start/pause, reset, pick different variables and start to collect data into a file.
One thing to be noted that, since plotly can only take a maximum of 20~25 Hz (20~25 times per second), I added a 40ms (0.04s) delay to every reading. You can turn of this behavior by setting reduce_freq = FALSE but you will be at risk of freezing your R session if your sampling frequency is too high. If you really need to collect high frequency sampling data, please use ar_collect, which is much simpler to do this job. Also, as human beings, we can only see things at around 24Hz while many sensor can give us a maximum of 8000Hz sampling rate. I would say just try to be a minimalist when you pick your sampling frequency.
“But I want your accelerometer example…”
Previously, in my tweet, I was using a ESP8266 microcontroller unit (MCU) + a MPU9250 9-axis motion sensor. Both are quite common nowadays. I picked ESP8266 because it has a Wifi module. (If I know how 🤔,) I should be able to setup a websocket server and send data to my computer through Wifi but at least for now, I’m still relying on USB serial connection. If you know how to get the Wifi piece work, feel free to DM me on twitter or leave a comment below. MPU9250 is a pretty common kit for motion activity. I remember iPhone 6 was using its prior version MPU6050.
If you get all the chips on Amazon, the whole cost will be like $20 for an individual project but if you have a friend in China, you can ask him/her to get them for you on taobao, where it can go really cheap. It will be around or below $10 in total.
For the arduino code, I was basically following this example on the official website. The tutorial is for MPU6050 but since MPU9250 is basically a MPU6050 + a magnetometer, if you are not looking for anything like motion fusion, they are pretty much the same.
Once you setup the chip correctly, the rest should be the same.